As a refresher, my initial model was quite simple: I used final BCS/Playoff rankings from 1998-2014 to determine the likelihood of a team making the top four/playoff given their number of losses and conference membership (There were four buckets: 0, 1, and 2-loss teams from major conferences and 0-loss teams from elsewhere. No one else has ever made the top 4). I then simulated the season a bunch of times using ESPN's FPI metric to determine how likely each team was to fall into each bucket. Over the course of the season, I noted the improvements that I wanted to make, as the initial model was purposefully just a skeleton. And sure enough, I made most of those changes. I didn't quite get to everything, but by and large I think this version of the model is much better (I'll show an example in a bit). What follows are the details behind the changes. If you're impatient and want to see the rankings, they're about halfway down.
Improvement #1: Other ratings systems exist
I used FPI exclusively last season for a few reasons. One, it was updated early Sunday morning, so I could run my simulations as soon as possible. Two, it was presented in points above/below average, which is easy to translate into spreads and thus, win probabilities. Three, I follow some of the people behind FPI on Twitter, and I know they know what they're doing. In all, FPI was a fine tool for the first go-around.
Still, there were issues. FPI was very high on Baylor and TCU when most other ratings systems were more wary. Sure enough, both teams lost a few games, and didn't end up being the surefire playoff bets that FPI thought they were. But because my system relied only on FPI, TCU and Baylor remained a little higher all season than they should have been. To be clear, FPI is still a good system, but like any metric it's subject to outliers. Thus, I decided to add in two other metrics that fit the second and third criteria listed above: Jeff Sagarin's Pure Points metric and Bill Connelly's S&P+. With these additional metrics in the fold, I hope to reduce the effect of outliers, and produce a more balanced picture of the coming season.
*You might ask, how am I going to combine these metrics? Luckily, I saved all the data for these three ratings from last season, so I was able to compare that to actual results. I used Solver to determine the combination of the ratings that best predicted those results. The outcome was basically 0.5*FPI + 0.3*Sagarin + 0.2*S&P, so that is what I will use for this season. I will continue to revisit this yearly.
Improvement #2: Strength of schedule matters (AKA The Alabama-Iowa Problem)
My initial model cared only about which conference/losses bucket you were in, and how likely you were to finish in each bucket. This was enough information to work pretty well, but it was clearly missing something. For the best example of this, take a look at the playoff probabilities going into the final two weeks of 2015:

In this instance, one of the best teams in the nation (one-loss Alabama) trailed behind a vastly inferior Iowa. Sure, Iowa was undefeated at the time, but they were ranked behind Alabama in the committee's rankings (4th to the Tide's 2nd), which reflected that they might not actually be as likely to make the playoff as my model suggested. To be clear, Iowa was less likely to avoid a loss in the final two weeks, as their coin flip games at Nebraska and against Michigan State led to a ~25% chance of winning out. But while that was captured in my model (that's why an undefeated team was just 17 percentage points in front of a one-loss team), the further difference captured in the committee's ranking was not. And it was reasonably clear that the difference was strength of schedule.
The questions that follow from this are twofold: How do I incorporate this, and how well does it work? The first question seems difficult, given that strength of schedule is a rather nebulous calculation. That said, given the committee's Luddite-like tendencies, I felt it was safe to use the basic SOS calculation employed by the NCAA. That formula is simply 2/3 opponent's record plus 1/3 opponent's opponent's record (opponent's record do not include the team in question, nor do they count games against non-FBS teams).
As for the second question: It works really well. It didn't make much of difference for undefeated teams, as only one major conference team has missed out on the top four (2012 Ohio State, who was on probation) and only two minor conference teams have reached that high (2009-2010 TCU). Thus, I kept my basic models for those groups. Only 9 2-loss teams have made a top four, so I wasn't sure if SOS would be helpful for that group either. But, four of the top six SOS teams from that bucket made the top four (plus the logit model for that bucket looked good), so I decided to keep the SOS calculation for this group:

But where the SOS calculation came in really handy was the one-loss major conference bucket. This makes sense, as just over 50% of these teams have made the top four, meaning this is the most pivotal of the buckets by far. The relationship between SOS and playoff qualification was so strong than 18 of the top 19 teams made the top four:
...and the none of the bottom eight made the top four:


Well, look who the top four are. Seems like this fixed the Alabama-Iowa problem. Cool.
Improvement #3: Adjusting for Conference Title Games
I know what you might be thinking, and no, this does not mean I started including conference title game victories as a separate variable in my model. While this may indeed turn out to be an important factor to the committee, we have yet to see an affect in the final voting that can't be attributed to simple strength of schedule adjustments (if you play a conference title game against a good team, your SOS will get a boost over the Big 12 team playing Iowa State or whomever).
What this does mean is that my shortcut from last year (simply give everyone eligible for a conference title game 0.4 extra losses until they're confirmed/eliminated) was too simple and has been replaced. The most proper way to do this would be to simulate full seasons and then determine who would qualify for each title game at the end, add those up, and factor them in. I didn't think I would have the time to fully implement this change in time, but I totally did. The change from simulating team-seasons to full seasons took some coding, but we now have better insight into the precise interplay between schedule and team strength that leads to conference title berths. I did not spend time calculating tie-breakers, and instead just assigned the division title randomly in the event of a tie. This isn't perfect, but it gets us close enough to not justify the extra work of figuring out weird tie-breakers. I can't imagine not building this functionality sways anything by more than 1 to 2%.
Now that we've properly accounted for the negative that comes from conference title game participation, we need to also add in the positive affect: A small bump in SOS. If we look at our dataset, title game participants shows a notable bump in this metric (major conference numbers only):
Average SOS for title game winner: 0.564
Average SOS for title game loser: 0.553
Average SOS for non-title game team: 0.541
This means that simply participating in a title game increases your SOS by 3% (1% for non-major conference teams). This could very well be the rumored "title game bump," so I included this small modification in my final model. To illustrate, it had the effect of moving Florida State's playoff odds from 48% to 51%, all else being equal. In all, it's not a major thing (and it doesn't cancel out the risk of losing the title game), but it does allow for a slight benefit for taking on the extra opponent. I will likely research this more in the future, once we have more data from the committee, as I don't think this supposed bump would be as likely to show up in BCS data. For now, I feel this properly represents the risk/reward trade-off of conference title games.
The Actual Rankings Finally Thank God
Now that I've bored you to death, here are the actual rankings for 2016. I left off any team below a 0.01% chance of making the playoff. Rest assured, these teams are not "eliminated" yet (except for you Hawaii...sorry), but they probably won't be a factor.
| Rank | Team | Agg Rank | POFF Prob |
| 1 | Oklahoma | 2 | 56.129% |
| 2 | Clemson | 4 | 52.662% |
| 3 | Florida State | 5 | 51.231% |
| 4 | Alabama | 1 | 46.743% |
| 5 | LSU | 3 | 41.411% |
| 6 | Ohio State | 8 | 24.148% |
| 7 | Tennessee | 6 | 18.918% |
| 8 | Michigan | 9 | 16.279% |
| 9 | Ole Miss | 7 | 11.469% |
| 10 | Notre Dame | 17 | 11.273% |
| 11 | Oklahoma State | 15 | 8.474% |
| 12 | Washington | 12 | 7.448% |
| 13 | USC | 10 | 6.942% |
| 14 | UCLA | 11 | 6.754% |
| 15 | Baylor | 16 | 5.592% |
| 16 | Louisville | 19 | 5.172% |
| 17 | Georgia | 13 | 3.500% |
| 18 | TCU | 22 | 3.043% |
| 19 | Stanford | 14 | 2.844% |
| 20 | Michigan State | 28 | 2.774% |
| 21 | Boise State | 34 | 2.063% |
| 22 | Iowa | 29 | 1.777% |
| 23 | North Carolina | 25 | 1.506% |
| 24 | Nebraska | 27 | 1.419% |
| 25 | Texas A&M | 18 | 1.306% |
| 26 | Oregon | 24 | 1.263% |
| 27 | Penn State | 36 | 1.197% |
| 28 | Miami (FL) | 32 | 0.751% |
| 29 | Arkansas | 23 | 0.711% |
| 30 | Auburn | 20 | 0.694% |
| 31 | Texas | 30 | 0.560% |
| 32 | West Virginia | 35 | 0.485% |
| 33 | Pitt | 31 | 0.463% |
| 34 | Florida | 21 | 0.439% |
| 35 | Western Michigan | 56 | 0.372% |
| 36 | San Diego State | 58 | 0.262% |
| 37 | Wisconsin | 33 | 0.251% |
| 38 | Utah | 37 | 0.231% |
| 39 | Mississippi State | 26 | 0.205% |
| 40 | Texas Tech | 43 | 0.148% |
| 41 | North Carolina State | 40 | 0.108% |
| 42 | Air Force | 69 | 0.108% |
| 43 | Washington State | 41 | 0.101% |
| 44 | Arizona | 42 | 0.080% |
| 45 | Houston | 39 | 0.079% |
| 46 | Temple | 64 | 0.070% |
| 47 | Northwestern | 48 | 0.064% |
| 48 | Appalachian State | 66 | 0.052% |
| 49 | Toledo | 72 | 0.052% |
| 50 | Virginia Tech | 38 | 0.042% |
| 51 | South Florida | 47 | 0.041% |
| 52 | Northern Illinois | 78 | 0.029% |
| 53 | Western Kentucky | 61 | 0.029% |
| 54 | Arkansas State | 90 | 0.029% |
| 55 | Boston College | 52 | 0.027% |
| 56 | Indiana | 59 | 0.023% |
| 57 | Cincinnati | 65 | 0.020% |
| 58 | Arizona State | 45 | 0.018% |
| 59 | Middle Tennessee | 84 | 0.017% |
| 60 | Navy | 68 | 0.015% |
| 61 | Minnesota | 55 | 0.013% |
| 62 | Missouri | 50 | 0.009% |
| 63 | Georgia Tech | 46 | 0.009% |
| 64 | Marshall | 77 | 0.009% |
| 65 | Southern Miss | 86 | 0.006% |
| 66 | Duke | 51 | 0.004% |
| 67 | Syracuse | 62 | 0.004% |
| 68 | Maryland | 70 | 0.003% |
| 69 | Bowling Green | 82 | 0.003% |
| 70 | Central Michigan | 85 | 0.003% |
| 71 | Georgia Southern | 83 | 0.003% |
| 72 | BYU | 44 | 0.003% |
| 73 | Louisiana Tech | 92 | 0.003% |
| 74 | Vanderbilt | 54 | 0.003% |
| 75 | California | 49 | 0.002% |
| 76 | Virginia | 63 | 0.002% |
| 77 | Rutgers | 81 | 0.002% |
| 78 | Kansas State | 57 | 0.001% |
| 79 | Kentucky | 60 | 0.001% |
| 80 | Wake Forest | 71 | 0.001% |
| 81 | South Carolina | 53 | 0.001% |
| 82 | Illinois | 73 | 0.001% |
The main takeaway is that the top five teams in the aggregate rankings remain the top five in the playoff rank, with a slight re-ordering due to relative strengths of schedule (the SEC is still hard). Beyond that, Notre Dame gets a bump largely due to having only three true road games, and USC drops because of their ridiculous schedule. We'll dig into the team-by-team subtleties more in the week-to-week posts.
Combining everything by conference paints an interesting picture:
| Conference | Exp Playoff Teams |
| SEC | 1.254 |
| ACC | 1.120 |
| B12 | 0.744 |
| B10 | 0.480 |
| P12 | 0.257 |
| IND | 0.113 |
| MWC | 0.024 |
| MAC | 0.005 |
| AMER | 0.002 |
| CUSA | 0.001 |
| SB | 0.001 |
Most notably, the SEC and ACC have decent chances of putting a pair of teams into the playoff. On the flipside, the lack of a dominant team combined with a bunch of good ones seems to doom the Pac 12's chances. Boise State gives the Mountain West the only real shot from outside of the Power 5, although Houston would obviously make noise if they can pull the big upset against Oklahoma.
Conference Title Races
As I am now tracking conference winners for all championship-game-having conferences, I thought I would include division title odds for those leagues. I won't post all of these weekly, but I thought it would be fun to do at the beginning of the season.
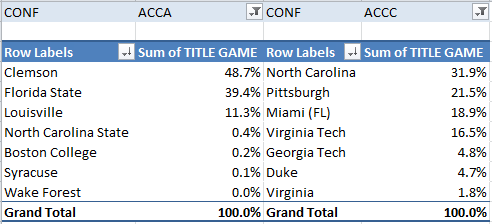
The three best teams in the ACC all reside in the Atlantic division, which makes for a tight race. The other side has six of the next seven best teams, which makes for the most wide-open major conference race. Should be fun.

The American has slightly more straightforward favorites than the ACC, with a Houston-USF matchup occurring roughly one-third of the time. Still, there are enough challengers that could add some intrigue, especially in the East, where every team should be at least competent.
Poor Michigan State...so much disrespect. But when you lose as much as they did, and don't have the recruiting prowess of the teams above you, you're going to take a hit. I still have some confidence that D'Antonio can pull off another amazing season, but admit that it's entirely fair of the numbers to be more doubtful. In the West, Minnesota's easy schedule has been passed around as a reason to get behind the Gophers, but that doesn't mean they'll be able to just waltz past the three better teams in the front of them. On the other end of the spectrum, Wisconsin's ridiculous schedule does mean that they're at a major disadvantage.

The CUSA apparently only has five good teams, which sounds about right. The conference's pursuit of good markets over good programs has hurt it a bit, but there's still enough at the top to make for a potentially interesting race.

Row the damn boat.

I honestly think that the Aztecs are underrated in this, and that Air Force is the only team with a semi-realistic chance of upending the favorites. But we shall see.

The Pac-12 race involves a bunch of relatively evenly-matched teams. Thus, the difference in title game odds, comes down to a matter of schedule. USC plays all three of the top teams from the north, while UCLA draws only Stanford, hence the Bruins' increased odds. This also affects the North, as Stanford and Washington are pretty close in the aggregate ratings, but Washington gets the easier road, avoiding UCLA. Luckily, if UCLA and Washington keep winning, they won't be able to avoid matching up in the title game.

LSU finishes slightly ahead of Alabama for two reasons: One, their battle with the Tide is in Baton Rouge. Two, LSU misses Tennessee in the cross-conference games. On the other side, don't mess this up, Tennessee. Also, if you forced me to pick a sub-1% team from any conference, I would probably take Mizzou. That defense with a competent offense could make for a repeat of 2014 if everything falls just right.
Weekends, Ranked
Now for my favorite part: previewing every weekend of the season, and telling you what's going to be great about them. As with last year, I will use a rather crude formula called "Playoff Teams Lost" that simply multiplies the odds of each team losing by 1/3 of their playoff odds. This means that middling games involving a top team will often be ranked ahead of a close-matched game between lower-ranked teams. You may disagree with that methodology, but since the Playoff is so central to the game at this point, I think it is appropriate.
Week 1 - 0.302 playoff teams lost (Rank: 2nd of 13)
1. Florida State (60% win probability) vs. Ole Miss - 0.091 playoff teams lost
2. Alabama (71%) vs. USC - 0.061
3. Auburn at Clemson (70%) - 0.054
I'm not a huge fan of playing games in NFL stadiums, but if that's the price to pay for amazing first week matchups, then I will gladly accept that trade-off. All of the top-five teams take on a legitimate challenge to start the season with Oklahoma playing Houston and LSU travelling up to Green Bay to play the Badgers. As a result, we have a weekend that is nearly twice as important at the same weekend last year. I can't wait.
Week 2 - 0.052 playoff teams lost (Rank: 14th)
1. Tennessee (83%) vs. Virginia Tech - 0.011
2. Western Kentucky at Alabama (96%) - 0.006
3. Arkansas at TCU (59%) - 0.006
Yes, this weekend is so bad that it falls behind a weekend I'm not even writing up (Week 14, in which Bedlam (by itself) is more important than all games from Week 2). The weather should still be nice, so maybe plan a fun activity with the family*, because there is absolutely nothing worth watching until sundown.
*Honeycrisps are usually ready right about this time...just saying.
Week 3 - 0.356 playoff teams lost (Rank: 1st)
1. Ohio State at Oklahoma (74%) - 0.108
2. Alabama (59%) at Ole Miss - 0.086
3. Florida State (66%) at Louisville - 0.070
The best weekend of the year has six games that surpass the importance of Week 2's best game (the others being ND-MSU, LSU-Clanga, and Stanford-USC). The good news is that the top three games are spread evenly throughout the day. The bad news is that most of the other great games are at night. I will need more screens.
Week 4 - 0.219 playoff teams lost (Rank: 10th)
1. LSU (72%) at Auburn - 0.041
2. Oklahoma State at Baylor (57%) - 0.024
3. Florida State (86%) at South Florida - 0.023
I'll be in a wedding this day. When I first looked at the schedule I was worried I would be missing a big weekend. While it still is big, it lacks the top-end sizzle of some of the others. For example, Ole Miss-Georgia (5th) is a great, rare matchup, but it isn't super likely to impact the Playoff race. LSU is the only top team with a real challenge, and even I'm thinking the numbers overstate Auburn's chances.
Week 5 - 0.263 playoff teams lost (Rank: 7th)
1. Oklahoma (73%) at TCU - 0.058
2. Louisville at Clemson (80%) - 0.049
3. Tennessee (54%) at Georgia - 0.035
Week 5 lacks the depth of Week 4, but features a few more high-end games. TCU is probably underrated (all of their returning injured players don't count in most ratings systems, plus Patterson seems to almost always outperform predictions), which should make their game against the Sooners a toss-up for the Big 12 lead. Down south, Georgia has a chance to beat the Vols (again), and take the upper hand into an eminently reasonable October and November slate. The best Friday night game of the year (Stanford-UW, 5th) likely won't affect the playoff race, but will be the most pivotal game in the Pac 12 North.
Week 6 - 0.268 playoff teams lost (Rank: 6th)
1. Florida State (77%) at Miami FL - 0.042
2. Alabama (75%) at Arkansas - 0.040
3. LSU (72%) at Florida - 0.040
Florida State checks in for the fourth time on this rundown. If they get through this point undefeated, they'll likely be #1 when the first playoff rankings come out. That is, unless Alabama has also gotten through their bevy of tough road/neutral games, their battle with the Razorbacks being the third of five.
Week 7 - 0.234 playoff teams lost (Rank: 9th)
1. Alabama (57%) at Tennessee - 0.102
2. Ohio State (68%) at Wisconsin - 0.026
3. Stanford at Notre Dame (56%) - 0.022
A pretty dreadful mid-season week is saved by its occurrence on the third weekend of October. If Tennessee gets out of this stretch (Florida, UGA, A&M, Bama) with just one loss or fewer, they'll be right in the mix. Much like Georgia, their schedule gets easier down the stretch.
Week 8 - 0.190 playoff teams lost (Rank: 12th)
1. Ole Miss at LSU (71%) - 0.067
2. Texas A&M at Alabama (83%) - 0.031
3. Ohio State (69%) at Penn State - 0.028
Week 8 has a few decent games, but the bye week hits pretty hard, leading to a lack of depth. I'm not sure why LSU-Ole Miss has been moved earlier the past few years, but it partially rescues a mediocre weekend, so I'm for it.
Week 9 - 0.297 playoff teams lost (Rank: 3rd)
1. Clemson at Florida State (56%) - 0.173
2. Michigan (62%) at Michigan State - 0.026
3. Miami FL at Notre Dame (71%) - 0.013
This is just Clemson's third appearance on this list, while most of the other contenders have appeared more often. What this indicates is that Clemson's schedule isn't quite as strong as the others. While this gives them a relatively good chance of going undefeated, it also underpins how important winning this game is. If they lose to the Noles and win every other game, they will likely miss out on the ACC title game and only have home wins over Pitt, Louisville, and Auburn as their best statements. As my algorithm shows, one-loss teams with poor schedules usually don't make the top four (although Clemson's schedule may not be that poor). We'll see if the Tigers can buck that trend, should they come up short.
Week 10 - 0.294 playoff teams lost (Rank: 4th)
1. Alabama at LSU (55%) - 0.148
2. Florida State (85%) at NC State - 0.029
3. Nebraska at Ohio State (76%) - 0.023
For the second straight week, a mediocre slate is buoyed between a game between teams in the top five. There's a slightly better chance one (or both) of LSU and Bama are beaten up before their game, so it's rated as slightly less important. Make no mistake though: if these teams make it to this point at or near the top of the rankings, Uncle Verne's last night game will be a doozy.
Week 11 - 0.262 playoff teams lost (Rank: 8th)
1. Baylor at Oklahoma (80%) - 0.052
2. LSU (73%) at Arkansas - 0.039
3. Pitt at Clemson (87%) - 0.024
Week 11 doesn't have the highlight game of the previous weeks, but it has some of the best depth. Washington-USC, Oregon-Stanford, and Iowa-Michigan should help make for a full weekend. The most interesting storyline may be in Arkansas, as the Novembert phenomenon has the chance to take down a contender at home yet again.
Week 12 - 0.194 playoff teams lost (Rank: 11th)
1. Ohio State (63%) at Michigan State - 0.036
2. Oklahoma (82%) at West Virginia - 0.035
3. USC at UCLA (55%) - 0.023
The pre-Thanksgiving weekend isn't as exciting as last year (when it was the 2nd best weekend entering the season), but there are still a couple good divisional races, as well as a potential tricky road trap for the Sooners. If USC has survived their gauntlet somewhat unscathed, they'll have a chance to win the South here.
Week 13 - 0.281 playoff teams lost (Rank: 5th)
1. Michigan at Ohio State (59%) - 0.065
2. LSU (68%) at Texas A&M - 0.046
3. Florida at Florida State (81%) - 0.035
Rivalry week takes a bit of a hit because some of the games (Bama-Auburn, Clemson-USC) aren't particularly even. Regardless, this will be a weekend with both depth and quality.